Navy Body Fat Calculator
Summary
Body Fat Level
Current vs. Healthy Comparison
| Metric | Current | Healthy Target |
|---|
Disclaimer: Results are estimates based on the U.S. Navy Body Fat Formula and BMI calculations. They are intended for educational purposes only and should not replace professional medical advice. Measurement accuracy directly affects the results.
Introduction
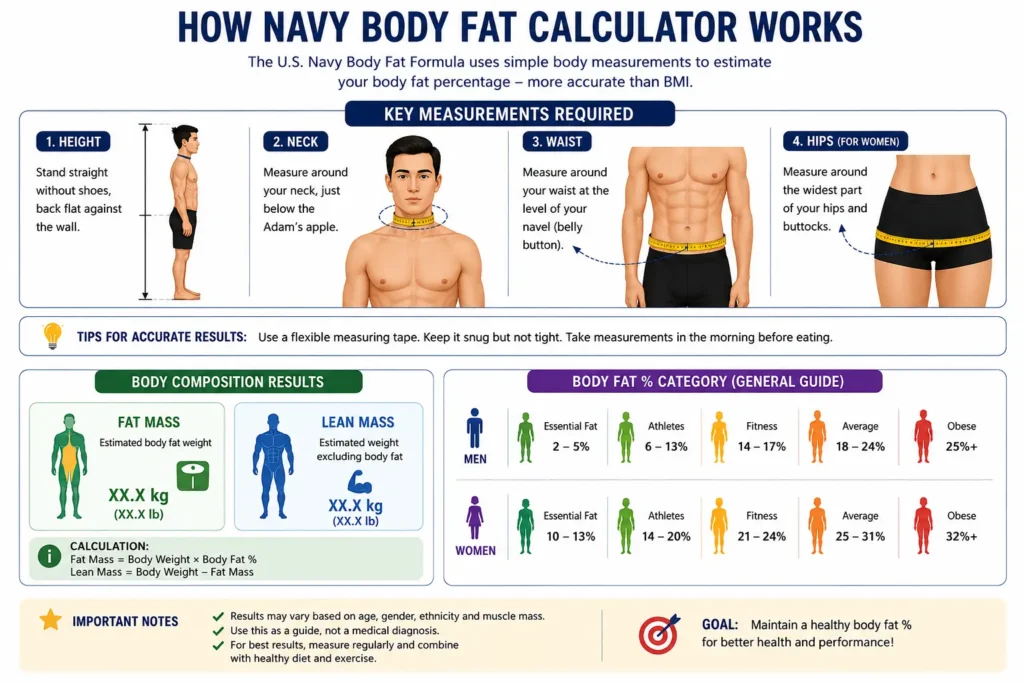
The Navy Body Fat Calculator estimates the percentage of your body weight that comes from fat using the U.S. Navy body fat method. It uses simple measurements such as height, waist, and neck, with hip circumference also used for women. This gives you an estimate of body fat and helps you understand your body composition beyond your scale weight.
Body weight alone does not show how much of your weight comes from fat versus lean mass such as muscle, bone, and organs. The Navy method can therefore provide additional information that a standard BMI Calculator cannot, making it useful for general fitness tracking and monitoring changes in body composition.
The result is an estimate rather than a direct measurement of body fat. Measurement technique and individual differences can affect the result, so use the calculator as a general reference rather than a medical diagnosis or official military assessment.
Body Fat Percentage Categories
| Category | Women (%) | Men (%) | What It Means | Health Level |
| 🟢 Essential Fat | 10–13% | 2–5% | Minimum fat needed for survival | Very Low |
| 🟢 Athletes | 14–20% | 6–13% | High fitness, strong performance | Excellent |
| 🟡 Fitness | 21–24% | 14–17% | Fit and healthy body | Good |
| 🟡 Average | 25–31% | 18–24% | Normal body range | Acceptable |
| 🔴 Obese | 32%+ | 25%+ | Excess body fat | Excess body fat |
These body fat ranges are based on guidelines from the American Council on Exercise (ACE)
Ideal Body Fat Percentage By Age
| Age (Years) | Women (%) | Men (%) | What It Means | Health Level |
| 20 | 17.7% | 8.5% | Very lean, youthful body | Excellent |
| 25 | 18.4% | 10.5% | Fit and active | Excellent |
| 30 | 19.3% | 12.7% | Healthy and balanced | Good |
| 35 | 21.5% | 13.7% | Normal healthy range | Good |
| 40 | 22.2% | 15.3% | Slight increase with age | Acceptable |
| 45 | 22.9% | 16.4% | Stable mid-age health | Acceptable |
| 50 | 25.2% | 18.9% | Moderate fat increase | Watch |
| 55 | 26.3% | 20.9% | Higher fat with aging | Caution |
These values are based on the Jackson & Pollock body fat research model.
What do you input?
- Measure height — Stand straight without shoes
- Measure neck — Just below Adam’s apple
- Measure waist — Around the belly button
- Measure hips (women) — Widest part of hips
- Enter values — Imperial and metric units
What do you output?
- Body Fat: This is the percentage of your total body weight that comes from fat.
- Fat Mass: This is the part of your body weight that is made up of fat.
- Lean Mass: This is the rest of your body weight that is not fat, like muscles, bones, and organs.
- Body Fat Category: This shows your fitness level based on your gender and body fat percentage.
What To Do After Getting Your Body Fat Result?
After using the Navy Body Fat calculation, the most crucial step is determining the next course of action. Your result is not just a number—it is a guide to improve your health. Based on your body fat percentage, you can follow a proper weight loss or weight gain or adjust your routine with the right calorie guidance to achieve better fitness results.
| Body Fat Level | What It Means | What You Should Do |
| 🔴 High (Obese) | Too much body fat | Reduce calories, start walking/exercising daily |
| 🟡 Average | Normal but can improve | Improve diet, add light exercise |
| 🟢 Fitness Level | Healthy and fit | Maintain current routine |
| 🟢 Athletic | Very fit body | Maintain + Strength training |
| ⚠️ Very Low | Too little fat | Increase calories, focus on nutrition |
Navy Body Fat Formula
The U.S. Navy Body Fat Formula uses body measurements to estimate your body fat percentage.
| Category | Formula | Explanation |
| Men (Standard) | BFP = 86.01 × log₁₀(Waist − Neck) − 70.04 × log₁₀(Height) + 36.76 | Uses waist, neck, and height to estimate body fat |
| Women (Standard) | BFP = 163.21 × log₁₀(Waist + Hips − Neck) − 97.68 × log₁₀(Height) − 78.39 | Includes hips for better fat estimation |
| Men (Metric Version) | BFP = 495 ÷ [1.0324 − 0.19077 × log₁₀(Waist − Neck) + 0.15456 × log₁₀(Height)] − 450 | More detailed calculation (metric system) |
| Women (Metric Version) | BFP = 495 ÷ [1.29579 − 0.35004 × log₁₀(Waist + Hips − Neck) + 0.22100 × log₁₀(Height)] − 450 | Advanced version for higher accuracy |
The equation was developed at the Naval Health Research Center (NHRC) in San Diego, California.
Note:
- Results are estimated values, not exact.
- For high accuracy, methods like DEXA Scan are used.
Navy Method vs BMI: Which is Better?
Understanding the difference between the BMI and the U.S. Navy Body Fat method is crucial for obtaining accurate health results.
BMI is a simple method that uses only height and weight to classify a person as underweight, normal, or overweight. It is quick and easy, but it cannot distinguish between fat and muscle. For example, a muscular person may have a high BMI but actually be very fit.
On the other hand, the Navy method uses body measurements such as waist, neck, height, and hips (for women). This helps estimate your actual body fat percentage, providing a clear and more realistic picture of your fitness level.
Navy Method vs BMI
| Feature | BMI | Navy Method |
| Uses | Height + Weight | Body measurements |
| Measures | Total body weight | Body fat percentage |
| Accuracy | Basic / Low | More accurate |
| Best For | General screening | Fitness & fat analysis |
| Muscle vs Fat | Cannot differentiate | Can estimate better |